Proteomics data analysis parameters
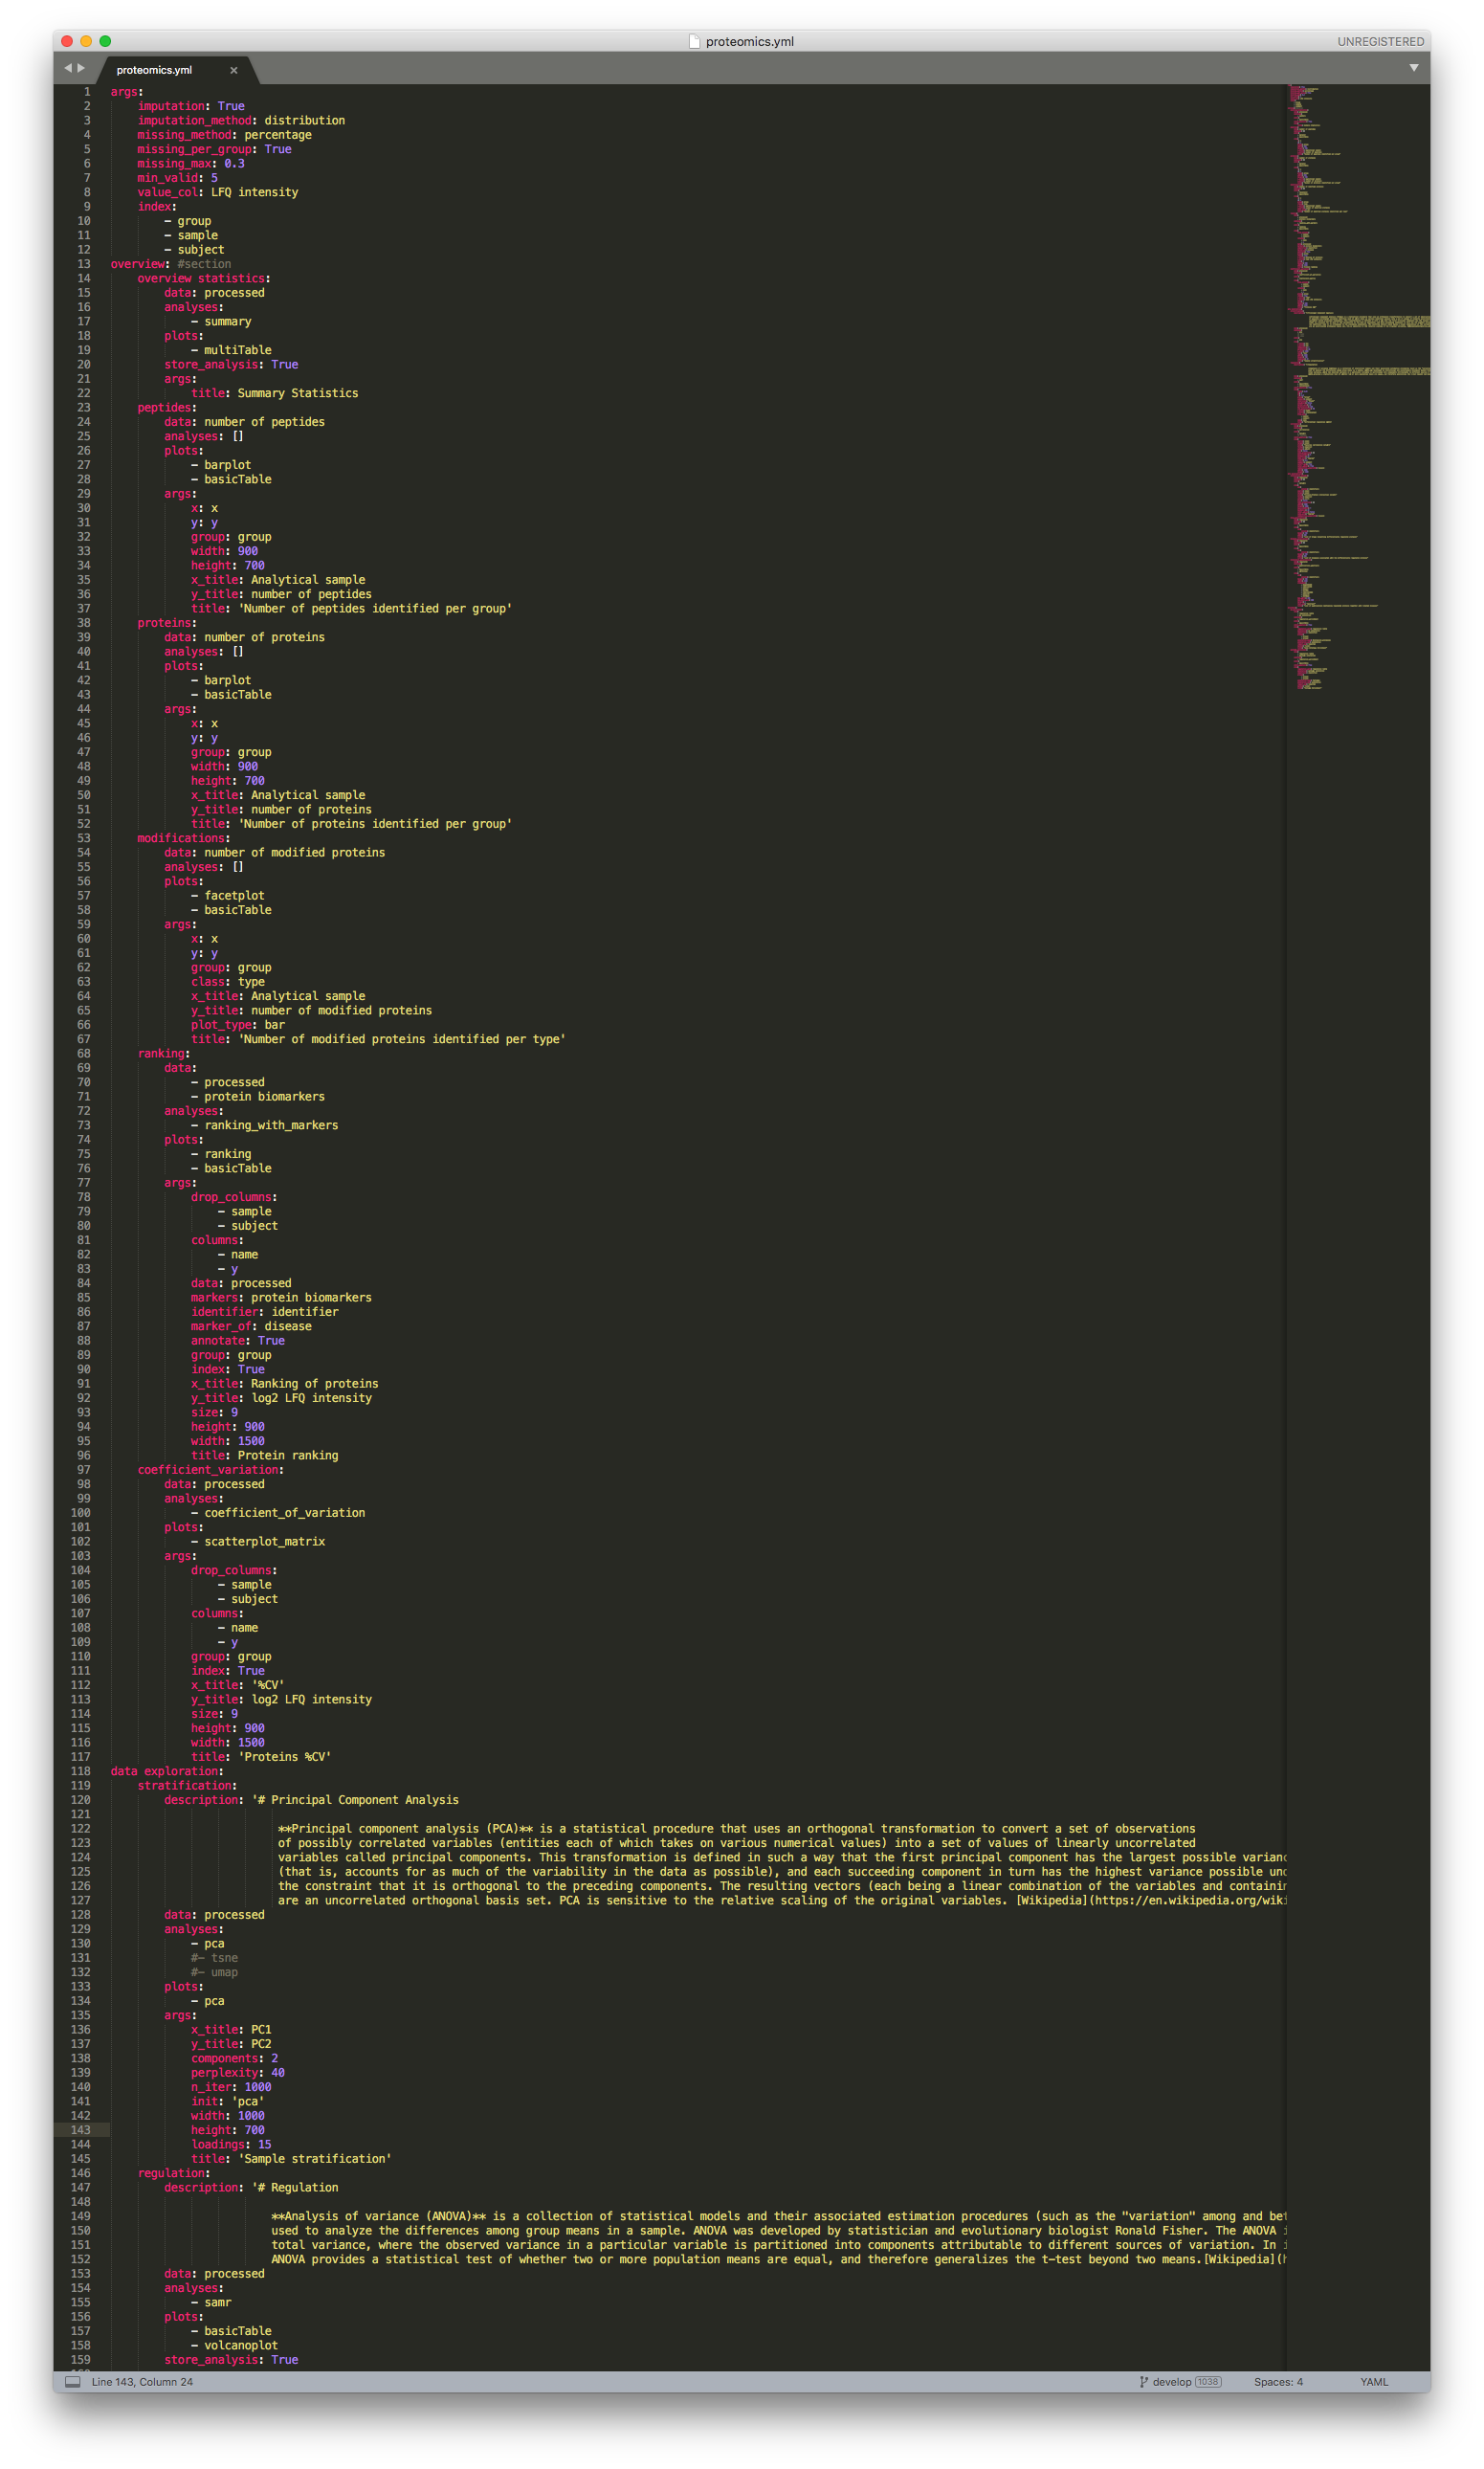
Similarly to the Clinical data analysis parameters, the Proteomics configuration file is divided into sections: args, overview, data exploration, data associations and enrichment.

Proteomics configuration file
The proteomics default analysis pipeline can be accessed here.
The args section contains the parameters used to process the proteomics data extracted from the CKG database, which includes the filtering of proteins according to the determined threshold, as well as the imputation of all missing values. These parameters include:
imputation: boolean. Set to True if missing values shall be imputed.
imputation_method: method for missing values imputation (“KNN”, “distribuition”, or “mixed”).
missing_method:
missing_per_group: boolean. If True, proteins are filtered based on valid values per group; if False filter across all samples.
missing_max: maximum ratio of missing/valid values to be filtered. (e.g. 0.3 filters all proteins with more than 30% missing values).
min_valid: minimum number of required valid values to keep a protein.
value_col: column label containing expression values.
index: column labels to be be kept as index identifiers.
batch_correction: boolean. If True, CKG will use adjust for batch effect
batch_col: column to be used as batch identifier (batch as default)
The result is a Pandas dataframe, stored as “processed”, where columns are protein identifiers (UniprotID~GeneName) and analytical samples are rows, group and subject identifier are kept as columns as well.
Note
We advise to change only imputation, imputation_method, missing_method, missing_per_group, and missing_max or min_valid.

Proteomics configuration file (continuation)
The second section (overview) corresponds to basic statistics and includes:
Data summary statistics (overview statistics)
Number of peptides per sample (peptides)
Number of proteins per sample (proteins)
Number of modifications per sample (modifications)
Dynamic range per group (ranking)
Coefficient of variation per group (coefficient_variation)
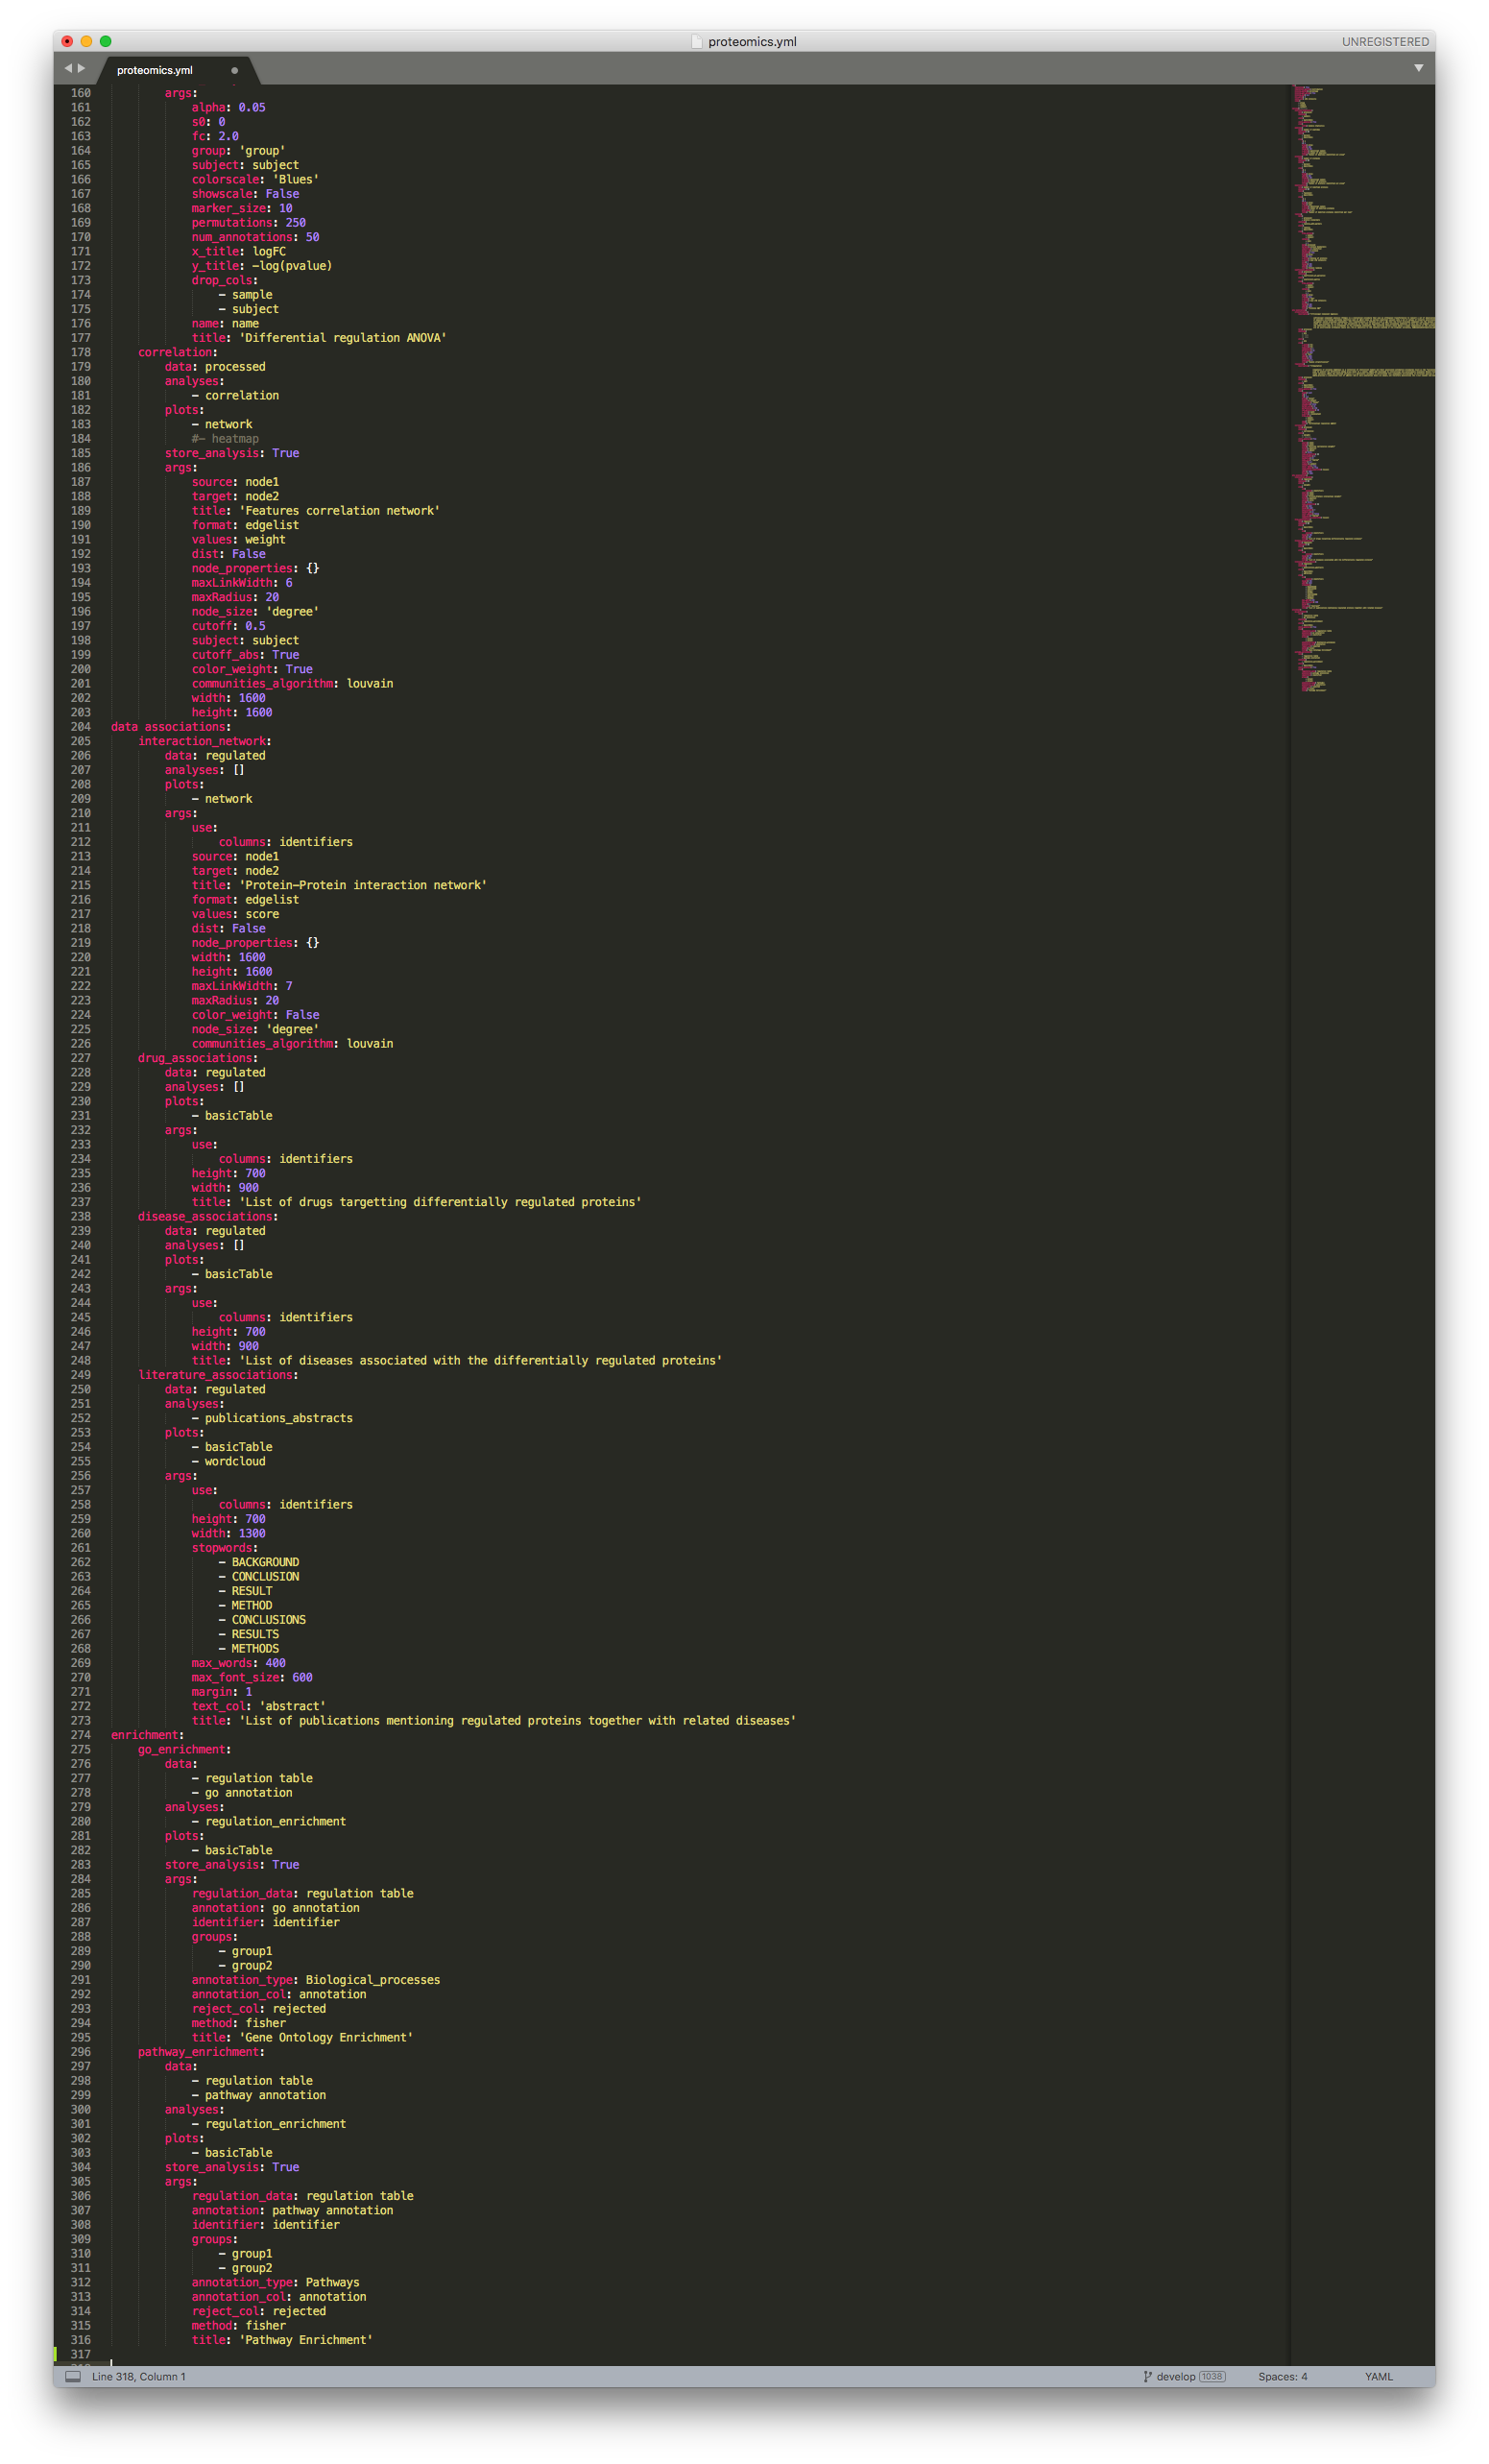
In the data exploration section, we look at the sample stratification (stratification), differentially expressed proteins (regulation), and protein-protein correlation network (correlation). In this section, you can choose to modify parameters like alpha (FDR value), s0 (artificial within groups variance) or fc (fold-change), to better fit your data and experimental design. Likewise, the correlation network is, by default, set to show correlations above 50% (cutoff: 0.5), this too can be changed.
The data associations section includes analyses that correlated differentially expressed proteins to proteins (interaction_network), drugs (drug_associations), diseases (disease_associations) and publications (literature_associations). All these associations are directly queried from the CKG database.
The last section in the default analysis pipeline corresponds to the enrichment analysis, and includes both Gene Ontology (go_enrichment) and Pathway (pathway_enrichment) enrichment analyses, using Fisher’s exact test (method: fisher)
Likewise in the Clinical data analysis parameters, within each analysis, specific parameters are defined:
description: Definition of the analysis used.
data: defines on which dataset dataframe the analysis will be ran (e.g. “clinical variables”, “original”, “processed”).
analyses: which statistical analysis to run on the
data. These functions are called from the mocduleanalytics_factory.py.plots: which plot to use to show the results of analyses. Functions also called from the mocdule
analytics_factory.py.store_analysis: boolean. True if the dataframe resulting from analyses is to be stored.
args: all arguments necessary for analyses and plots.
You can modify the analysis parameters just by changing the respective parameters within the configuration file. Remember to consult the modules analytics.py and viz.py, to learn more about the arguments of each function.