Clinical data analysis parameters
Clinical Data configuration file
Currently, the clinical default analysis pipeline can be accessed here.
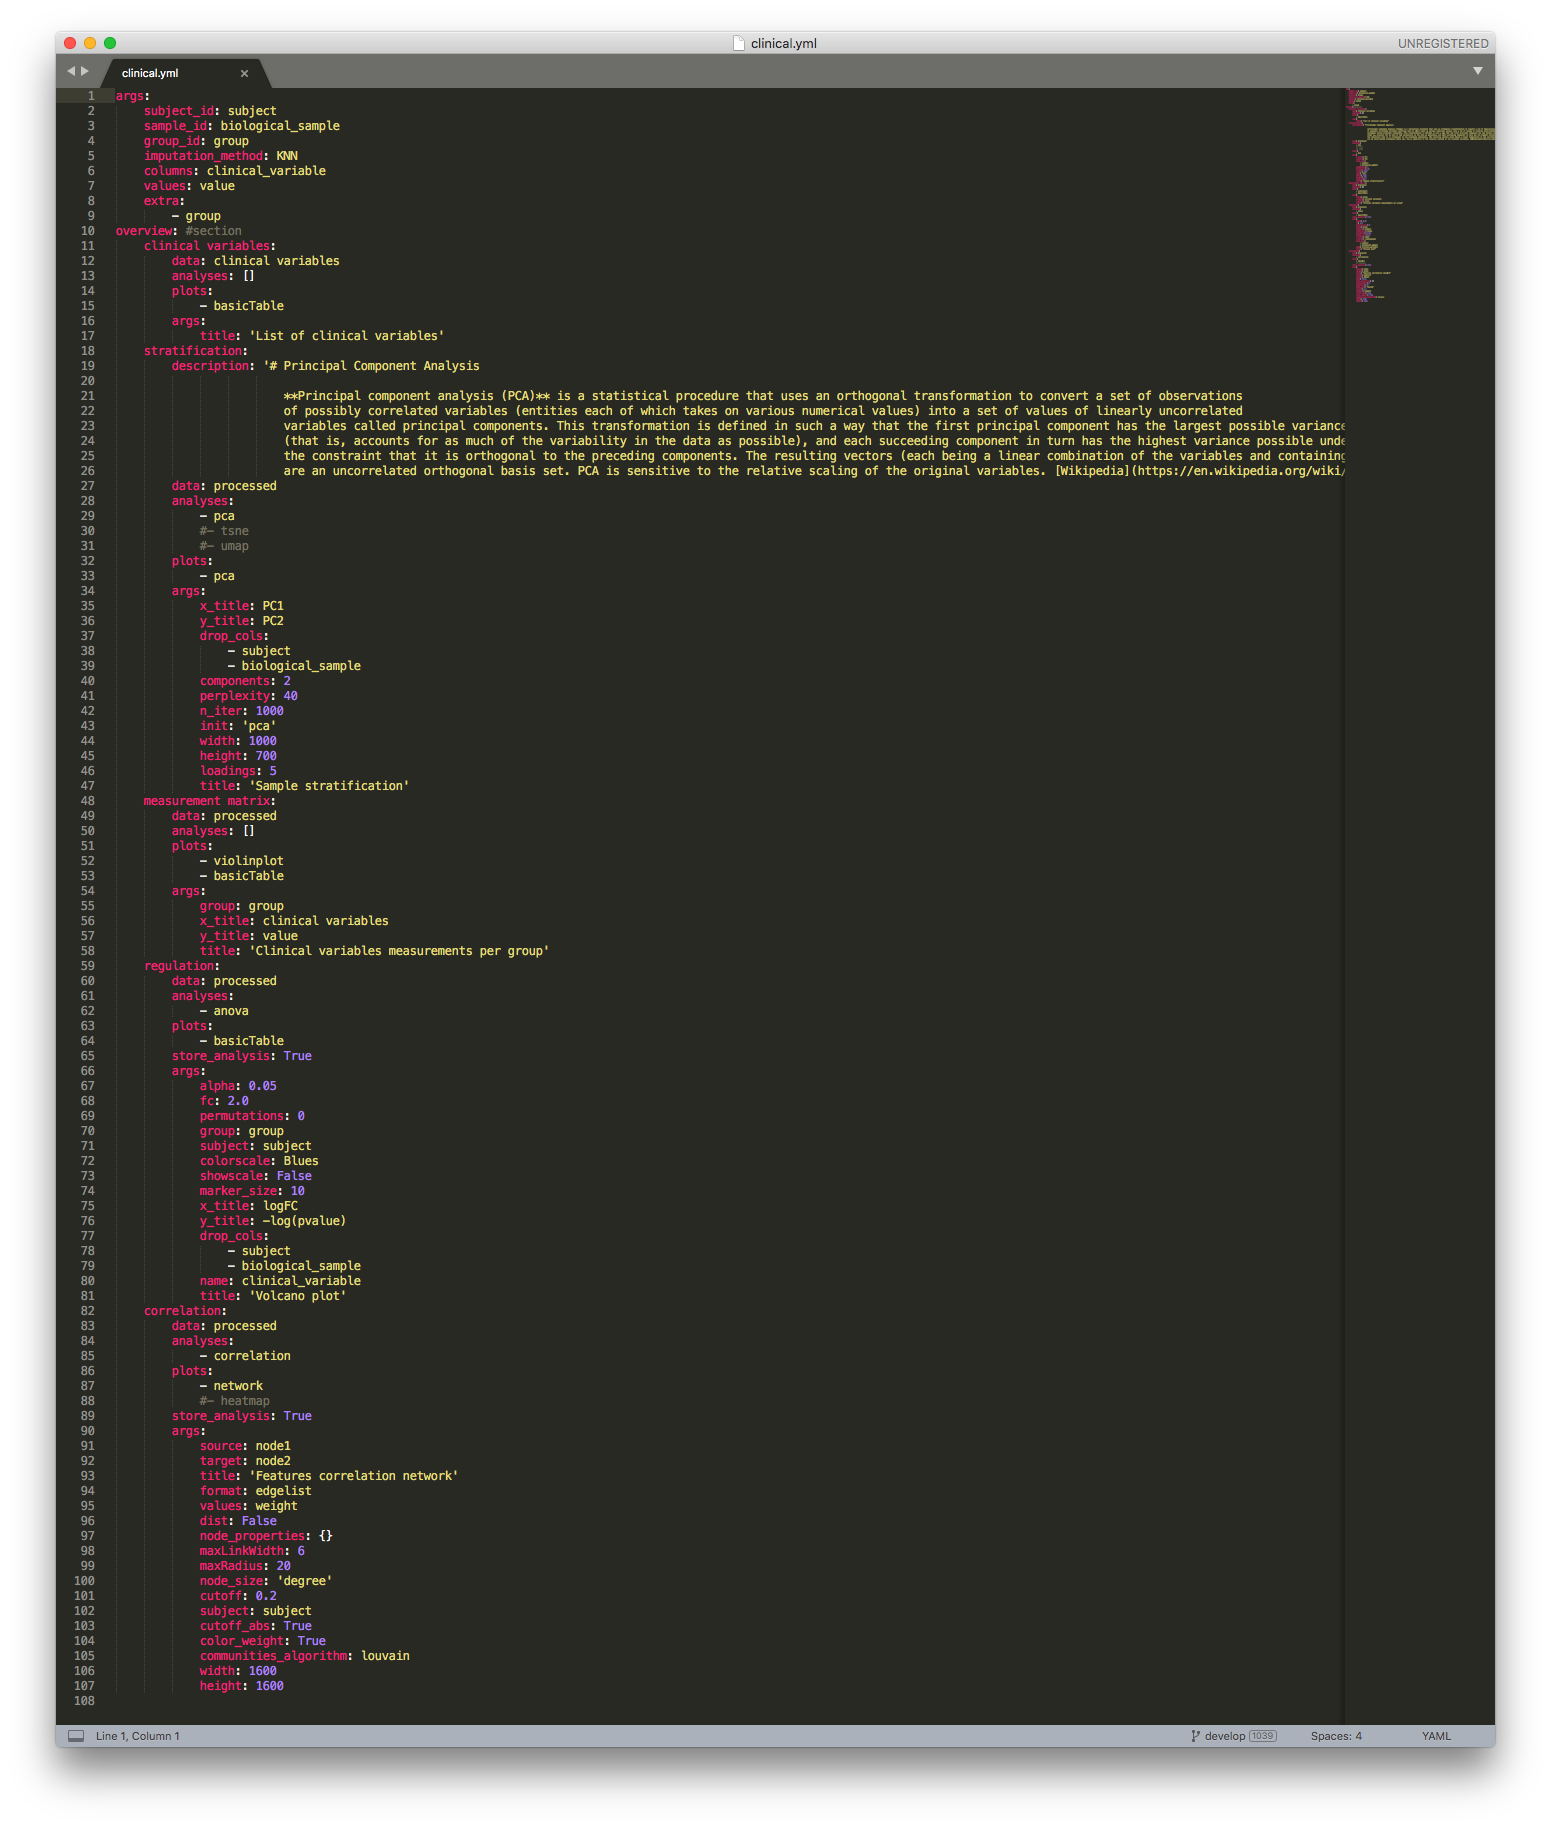
The Clinical data configuration file contains two sections: args and overview.
The first section contains the parameters used for the processing of the raw clinical data. To obtain the raw clinical data, we query the CKG database for all the clinical variables connected to biological samples in a specific project. This results in a Pandas dataframe with all the relevant information. To process the raw data, a number of parameters are defined in the args section of the configuration file:
subject_id: column label containing subject identifiers.
sample_id: column label containing biological sample identifiers.
group_id: column label containing group identifiers.
imputation_method: method for missing values imputation (“KNN”, “distribuition”, or “mixed”).
columns: list of column names whose unique values will become the new column names
values: column label containing clinical variable values.
extra: additional column labels to be kept as columns
The result is another Pandas dataframe, stored as “processed”, where columns are the clinical variables and biological samples are rows, group and subject identifier are kept as columns as well.
Note
We advise to change only imputation_method, if needed.
The second section (overview) depicts the analysis performed for the clinical data, and the parameters used to do it.
Among the analysis is:
Summary table (clinical variables)
Stratification plot (stratification)
Clinical variables per group (measurement matrix)
Hypothesis test (regulation)
Correlation network (correlation)
Within each analysis, specific parameters are defined:
description: Definition of the analysis used.
data: defines on which dataset dataframe the analysis will be ran (e.g. “clinical variables”, “original”, “processed”).
analyses: which statistical analysis to run on the
data. These functions are called from the mocduleanalytics_factory.py.plots: which plot to use to show the results of analyses. Functions also called from the mocdule
analytics_factory.py.store_analysis: boolean. True if the dataframe resulting from analyses is to be stored.
args: all arguments necessary for analyses and plots.
You can modify the analysis parameters just by changing the respective parameters within the configuration file. Remember to consult the modules analytics.py and viz.py, to learn more about the arguments of each function.